Press Release
|October 01,2025Private Home Prices Rose In Q3 2025, Helped By City Launches; Pace Of Hdb Resale Price Growth Continued To Ease: Flash Estimates
Share this article:
A flurry of new launches in Q3 2025, including several projects in the city has helped to prop up private home prices in the quarter, posting the fourth consecutive quarter of increase. Meanwhile, HDB resale flat prices rose at a slower pace in Q3 2025, marking the fourth straight quarter of easing price growth, according to flash estimates released today.
Q3 2025 URA Private Residential Property Index (FLASH)
Prices of private residential property edged higher in Q3 2025, rising by 1.2% QOQ amid robust primary market sales. This follows the 1.0% QOQ price growth in Q2 2025, and marks the second consecutive quarter where private home prices grew at a slightly faster pace (see Table 1). Taken together, the URA PPI has increased by a cumulative 3.1% in the first nine months of 2025 (9M 2025), based on the flash estimates. In 9M 2024, the URA PPI rose by 1.6%. The flash estimates cover transactions up till mid-September, and the final PPI data will be released on 24 October.
Table 1: URA Private Property Price Index (PPI) Q3 2025 Flash estimates
Price Indices | Q1 2024 | Q2 2024 | Q3 2024 | Q4 2024 | Q4 2024 | Q1 2025 | Q2 2025 | Q3 2025 F |
(QOQ % Change) | (YOY % Change) | (QOQ % Change) | ||||||
Overall PPI | 1.4 | 0.9 | -0.7 | 2.3 | 3.9 | 0.8 | 1.0 | 1.2 |
Landed | 2.6 | 1.9 | -3.4 | -0.1 | 0.9 | 0.4 | 2.2 | 1.4 |
Non-Landed | 1.0 | 0.6 | 0.1 | 3.0 | 4.7 | 1.0 | 0.7 | 1.1 |
CCR | 3.4 | -0.3 | -1.1 | 2.6 | 4.5 | 0.8 | 3.0 | 2.4 |
RCR | 0.3 | 1.6 | 0.8 | 3.0 | 5.8 | 1.7 | -1.1 | 0.4 |
OCR | 0.2 | 0.2 | 0.0 | 3.3 | 3.7 | 0.3 | 1.1 | 1.0 |
In Q3 2025, non-landed private homes prices climbed by 1.1% QOQ, accelerating from the 0.7% QOQ increase in the previous quarter. Within this segment, home prices in the Core Central Region (CCR) witnessed the steepest increase in the quarter, rising by 2.4% QOQ - building on the 3.0% QOQ growth in Q2 2025. The uptick in CCR home prices may be attributed to the flurry of new launches in this sub-market in Q3 2025, namely The Robertson Opus, UpperHouse at Orchard Boulevard, and River Green. According to caveats lodged, the three projects collectively sold 835 new units in the quarter (see Table 2 below) - helping to push overall CCR new home sales to around 900 units in Q3 2025 (till 21 Sep) which is the highest quarterly CCR sales since Q4 2010.
Over in the Rest of Central Region (RCR), non-landed private home prices rose by 0.4% QOQ in Q3 2025, reversing the 1.1% QOQ decline in the previous quarter. LyndenWoods and Promenade Peak were the two major new launches that had propelled sales and supported prices in the RCR. Based on URA Realis caveat data, LyndenWoods and Promenade Peak have each sold 336 units during the quarter since their respective launch dates.
Non-landed private home prices in the Outside Central Region (OCR) also climbed in Q3 2025, rising by 1.0% QOQ compared with the 1.1% growth in Q2 2025. The healthy demand for mass market homes has contributed to the resilient prices in the OCR. In particular, the 941-unit Springleaf Residence has shifted 883 (94% of total units) as per caveats lodged (till 21 Sep) since the project hit the market in August. Another new launch in the quarter, Canberra Crescent Residences sold 233 out of its 376 units (62%).
Table 2: New project launches (ex. EC) in Q3 2025
Project | Region | Units sold | Average transacted $PSF price |
SPRINGLEAF RESIDENCE | OCR | 883 | $2,176 |
RIVER GREEN | CCR | 464 | $3,120 |
PROMENADE PEAK | RCR | 336 | $2,969 |
LYNDENWOODS | RCR | 336 | $2,462 |
CANBERRA CRESCENT RESIDENCES | OCR | 233 | $1,986 |
UPPERHOUSE AT ORCHARD BOULEVARD | CCR | 202 | $3,304 |
THE ROBERTSON OPUS | CCR | 169 | $3,356 |
ARTISAN 8 | RCR | 16 | $2,388 |
Total | 2,639 | ||
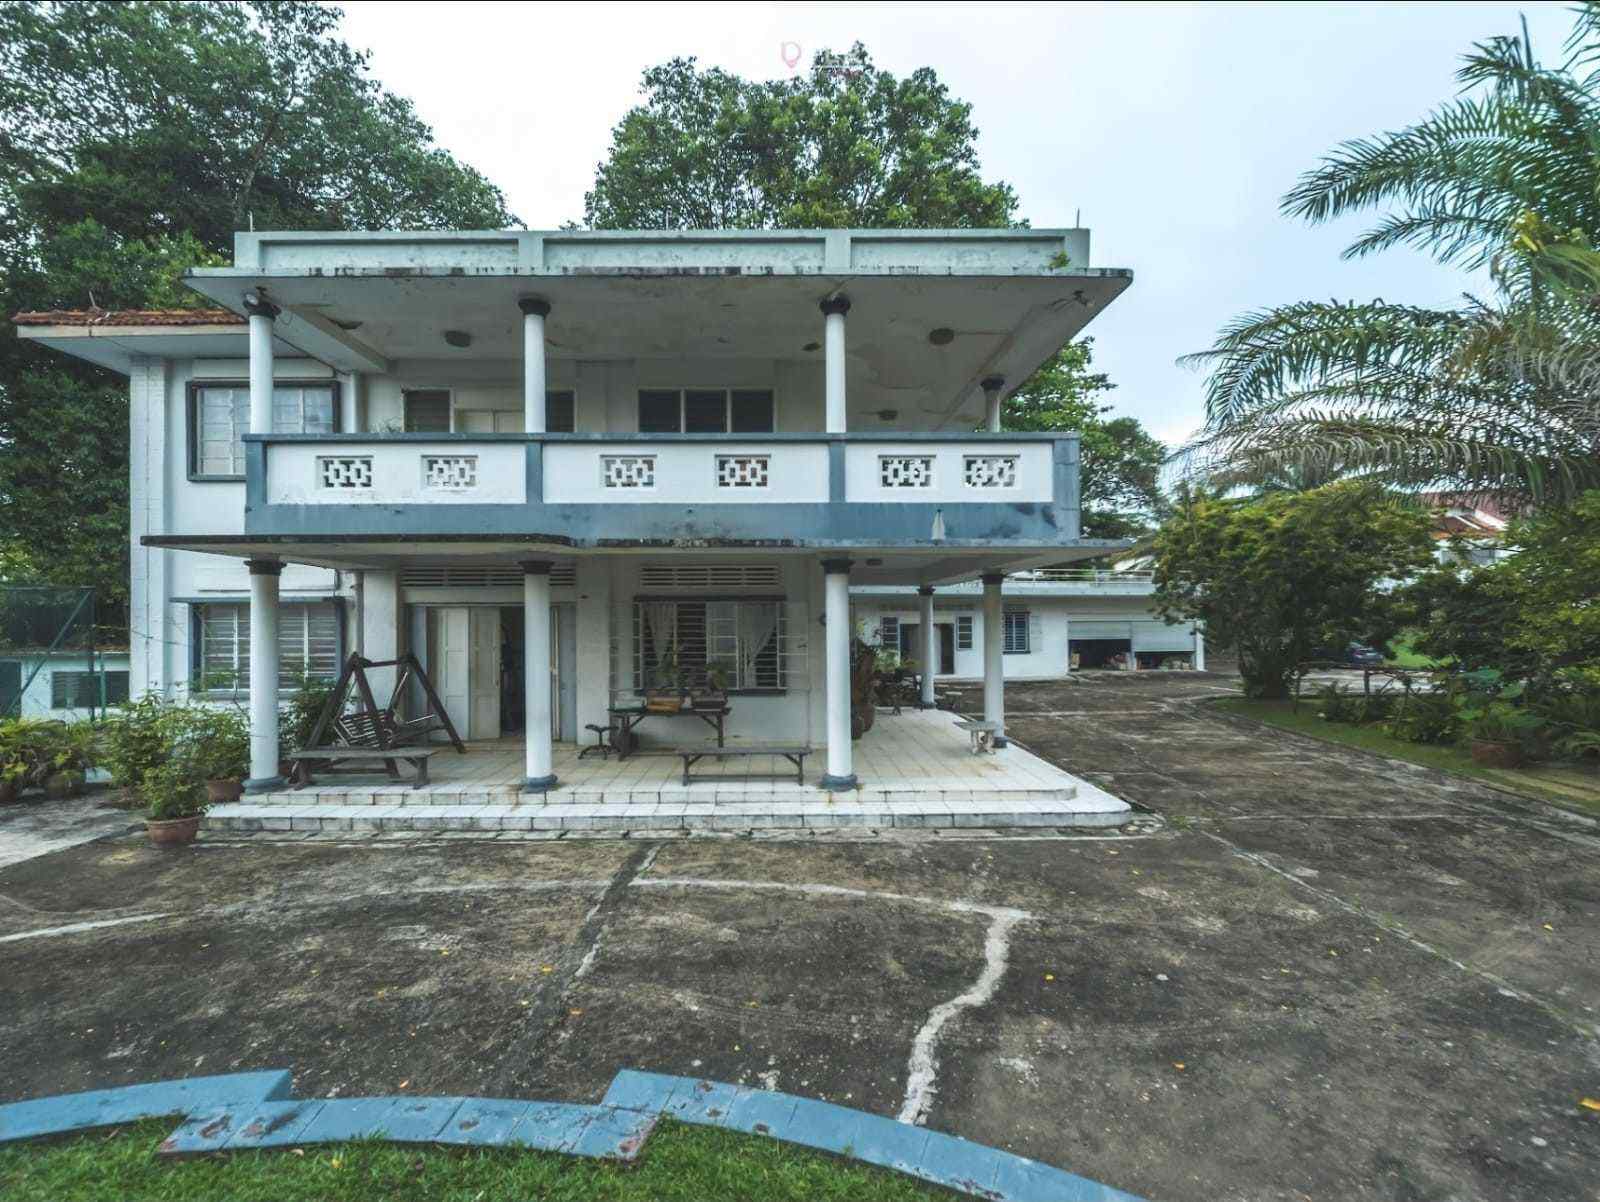
Meanwhile in the landed homes segment, prices continued to rise in Q3 2025, climbing by 1.4% QOQ following the 2.2% QOQ increase in the previous quarter. As per caveats lodged (till 23 Sep), the average transacted unit price on land rose in all three landed housing types - detached, semi-detached, and terrace - in Q3 from Q2 2025, with detached homes posting the steepest jump of 9% QOQ amid an uptick in sales volume to 49 transactions in Q3 from 46 in Q2 2025. Overall, there were 458 landed home transactions in Q3, down from the 509 deals in the previous quarter. The priciest landed home sold in the quarter was a detached house in the Chee Hoon Avenue good class bungalow area which had fetched $55 million.
Mr Kelvin Fong, CEO of PropNex said:
"The sustained buyer interest in new launches in Q3 2025 has helped to prop up private home prices. Overall, we expect the private residential property market to remain positive with modest price upside, particularly for well-located projects. For 2025, we project that private home prices may rise by 4% to 5% - close to the 3.9% increase in 2024. Based on URA figures and caveats lodged, developers have sold an estimated more than 3,200 new homes (ex. EC) in Q3 2025 (till 21 Sep), taking the sales this year to over 7,800 units (ex. EC). We believe the new home sales volume could reach 9,000 to 10,000 units (ex. EC).
A key highlight in Q3 2025 is the rebound in the CCR, as three launches - The Robertson Opus, UpperHouse at Orchard Boulevard, and River Green - drove sales. In our view, the CCR remains one to watch in Q4 2025, with the final CCR launch of 2025 coming up. The 666-unit Skye at Holland is competitively priced with prices of two-bedders starting from around $1.51 million, while prices of the three-bedders start from $2.40 million - which are in the pricing sweet-spot of many prospective homebuyers. The other upcoming launches in Q4 2025, including Penrith (RCR), Faber Residence (OCR), and Zyon Grand (RCR) will also provide more options for homebuyers and property investors.
Of note, about 68% of the new non-landed private homes (ex. EC) sold in Q3 2025 (till 21 Sep) were priced at below $2.5 million (see Table 3). From our observations, buyers are increasingly focused on value, amenity, and convenience. Hence, projects that are attractively priced and have strong transport links will see more robust demand, as seen in Springleaf Residence which sold an impressive 92% of 941 units on its launch weekend in August.
Table 3: Proportion of non-landed private new home sales (ex. EC) by price range
| Price range | Q1 2025 | Q2 2025 | Q3 2025 |
| Below $1.5 mil | 13.5% | 24.9% | 19.0% |
| $1.5 mil to <$2 mil | 37.9% | 20.0% | 28.9% |
| $2 mil to <$2.5 mil | 20.5% | 21.2% | 19.8% |
| $2.5 mil to <$3 mil | 15.0% | 13.9% | 14.7% |
| $3 mil to <$3.5 mil | 7.7% | 7.7% | 8.1% |
| $3.5 mil to <$4 mil | 4.0% | 7.0% | 4.9% |
| $4 mil to <$5 mil | 0.7% | 2.8% | 2.7% |
| $5 mil to <$10 mil | 0.6% | 1.8% | 1.6% |
| $10 mil and above | 0.2% | 0.8% | 0.2% |
| Total | 100.0% | 100.0% | 100.0% |
| % below $2.5 million | 71.9% | 66.0% | 67.7% |
Moving forward, we continue to be optimistic about the private housing market, amid lower interest rates, pipeline of attractive launches, as well as stable homebuying interest among first-timer buyers and HDB upgraders. In September 2025, the US Federal Reserve cut rates for the first time this year, and it is the fourth rate cut after 11 hikes from March 2022. Owing to downside risk to growth and the labour market in the US, some observers expect there may be two further rate cuts by the US Fed in Q4 2025.
We expect the moderation in interest rates to continue to support the property market in Singapore. In a PropNex consumer survey conducted earlier this year, about 55% of the 1,100 respondents said that they are either "motivated" or "very motivated" to purchase a residential property amid lower interest rates. As at 1 October 2025, the 3-Month Compounded SORA (Singapore Overnight Rate Average) - which banks used to price home loan packages - has fallen to about 1.45% p.a. from 3.02% p.a. at the start of 2025.
That said, amidst the rebound in sales and healthy buying interest, the macro environment remains a wildcard, including the US trade tariffs. The support factors for private housing demand and prices in Singapore continue to hinge on a positive economic outlook, tight labour market, and rising household income."
Q3 2025 HDB Resale Price Index (FLASH)
Flash estimates released by the Housing and Development Board (HDB) showed that resale flat prices rose at a slower pace of 0.4% QOQ in Q3 2025, decelerating further from the 0.9% QOQ increase in the previous quarter. This is the fourth straight quarter of slower growth in the HDB resale price index, and the price increase in Q3 2025 is also the slowest quarterly growth in over 5 years since the 0.3% QOQ increase in Q2 2020. Cumulatively, HDB resale flat prices have risen by 2.9% in 9M 2025 as per flash estimates - significantly slower than the 6.9% growth in 9M 2024.
The HDB noted that there were 7,157 flats resold in Q3 2025 (till 29 September 2025). This is slightly higher than the 7,102 HDB resale flats transacted in the previous quarter. The latest data took the number of resale flats sold to 20,849 in the first nine months of 2025 (till 29 September). In comparison, there were 22,562 HDB flats resold in 9M 2024.
Table 4: HDB Resale Price Index
Quarter | QOQ % change | YOY % change |
Q1 2022 | 2.4% | 12.2% |
Q2 2022 | 2.8% | 12.0% |
Q3 2022 | 2.6% | 11.6% |
Q4 2022 | 2.3% | 10.4% |
Q1 2023 | 1.0% | 8.8% |
Q2 2023 | 1.5% | 7.5% |
Q3 2023 | 1.3% | 6.2% |
Q4 2023 | 1.1% | 4.9% |
Q1 2024 | 1.8% | 5.8% |
Q2 2024 | 2.3% |
Explore Your Options, Contact Us to Find Out More!
Selling your home can be a stressful and challenging process, which is why
it's essential to have a team of professionals on your side to help guide you through the journey. Our
team is dedicated to helping you achieve the best possible outcome when selling your home.
Find Your Ideal Property: Take the First Step and Indicate Your Interest!More Property NewsDiscover New Launch Projects |
